


TLCI Results
 Colour science expert, GTC TiCA winner Alan Roberts, has supplied the results from his TLCI-2012 testing of lamps for the TV and film industries. The theory behind the TLCI-2012 was explained in detail in Zerb. Read the 'Practical Spectroradiometry' Zerb article.
Alan explains how the charts should be read:
The CRI (Color Rendering Index) has many flaws and is unreliable even when used for its original intended purpose, assessing lighting for industrial and architectural situations. It is even less meaningful if used in a television environment. Even CCT (Correlated Colour Temperature) meters are misleading and inaccurate if used with fluorescent or LED light sources.
The solution is the TLCI (Television Lighting Consistency Index) which, although not an approved international standard, is recommended by the EBU.
The TLCI takes a measurement of the spectral power distribution of a luminaire, using a spectroradiometer. It then analyses the performance of the luminaire in the context of television. It awards a single number value to the luminaire, on a scale from 0 to 100. The significance of the numbering is the same as the CRI, but with important differences. Unlike the CRI, where a score of greater than 90 is widely regarded as the minimum for television use, the TLCI-2012 scores are more spread out:
|
85 – 100 |
errors are so small that a colourist would not consider correcting them |
|
75 – 85 |
a colourist would probably want to correct the colour performance, but could easily get an acceptable result |
|
50 – 75 |
a colourist would certainly want to correct the errors, and could probably achieve an acceptable result, but it would take significant time to get there |
|
25 – 50 |
the colour rendering is poor, and a good colourist would be needed to improve it, but the results would not be to broadcast standard |
|
0 – 25 |
the colour rendering is bad, and a colourist would struggle for a long time to improve it, and even then the results may not be acceptable for broadcast |
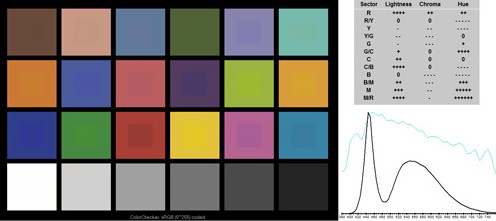
The standard report shows a Colorchecker chart. Each patch is the colour produced when the chart is lit by the reference source (which is a theoretical luminaire on the Planckian or Daylight locus, with a CT which matches the CCT of the test luminaire) through the television camera. It assumes, for accuracy, that the display you see it on is a Grade 1 HDTV monitor. Inset into each patch is the colour performance of the test luminaire. The camera is separately colour balanced to each source, so the grey scale is accurate.
There is a table of ‘advice to colourists' which shows the magnitude and direction of the corrections needed for lightness, chroma and hue, in each of 12 colour sectors. The more + and – symbols, the worse the performance and the harder it is to correct.
The spectral power distribution of the test and reference luminaires are given as well.
Across the top is the name of the test measurement and its CCT. Also, there is a number in brackets which indicates deviation from the CT locus (+ means magenta side, – means green side, a value greater than 1 means that the results are not truly meaningful). Below this is the name of the reference source, and the TLCI-2012 score in red.
* The TLCI-2012 results are supplied to the GTC by Alan Roberts from his measurements conducted on various lighting fixtures. They are linked to from this site in good faith without further verfication. The GTC takes no responsibility for the accuracy of these independently generated results.
See the latest TLCI-2012 results (last updated 04.02.19).
If you would like to download the charts, please visit the TLCI page on the EBU site:
https://tech.ebu.ch/tlci-2012
Where to next?


.jpg)
The Guild of Television Camera Professionals (GTC) is an independent craft association predominantly for professional TV, digital and film camera crew designed to support our members by facilitating excellence, education, knowledge and networking in moving image production. The GTC welcomes media professionals internationally across all moving image disciplines as members.
The International Association of Wildlife Film-makers, whose members are professional camera crew earning most of their income from making wildlife films, has been affiliated to the GTC since January 2016.
Useful Links
All content © The Guild of Television Camera Professionals. All Rights Reserved. Site by Diablo
